
HANG SENG, CSI 300 Index- Outlook:
- Hopes of more stimulus aiding HK/China equities.
- The CSI 300 and the Hang Seng Index appear to be building a base.
- What is the outlook and what are the key levels to watch?
Recommended by Manish Jaradi
Get Your Free Top Trading Opportunities Forecast
China/Hong Kong equities appear to be in the early stages of base building amid hopes of further stimulus.
Chinese authorities have pledged to support the fragile post-Covid economy recovery, focusing on boosting domestic demand, confidence and preventing risks. China’s State Council on Monday issued measures to restore and expand consumption in automobiles, real estate, and the service sector. The hope is for more measures to support the ailing property sector.
The economic growth outlook in the world’s second-largest economy has deteriorated in recent months, with consensus downgrading economic forecasts for the current year and 2024. Beijing has announced a series of measures in recent weeks to cushion some of the downside risks to the economy, including cuts in key lending benchmarks, targeted measures toward new-energy vehicles, the property sector, and the booming generative artificial intelligence sector, and signaled the end of the years-long crackdown on the technology sector.
Attractive valuations compared with some of its peers, generally oversold conditions, and higher risk premium (according to some estimates, pessimism toward China is at extreme levels) could trigger a repricing higher of HK/China equities.
Hang Seng Index Weekly Chart
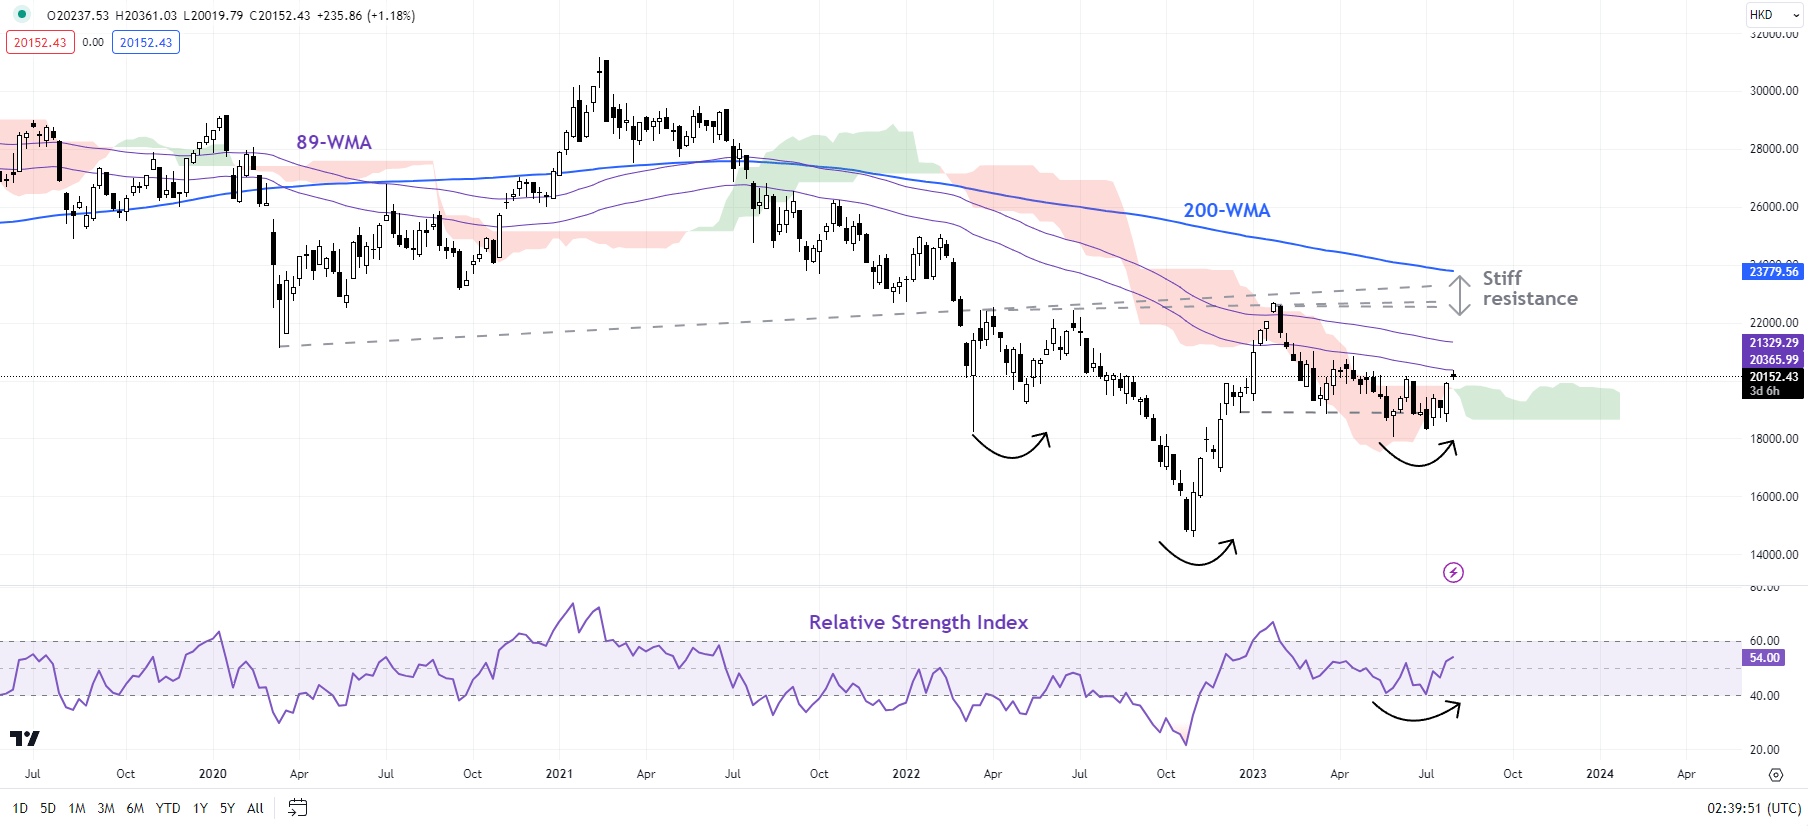
Chart Created Using TradingView
Hang Seng: Holding above key support
The upward momentum in the Hang Seng Index is improving as it attempts to break above a vital barrier at the mid-June high of 20155, roughly coinciding with the upper edge of a declining channel since April. Any break above would confirm that the immediate downward pressure had eased, opening the way toward the January high of 22700.
Hang Seng Index Daily Chart
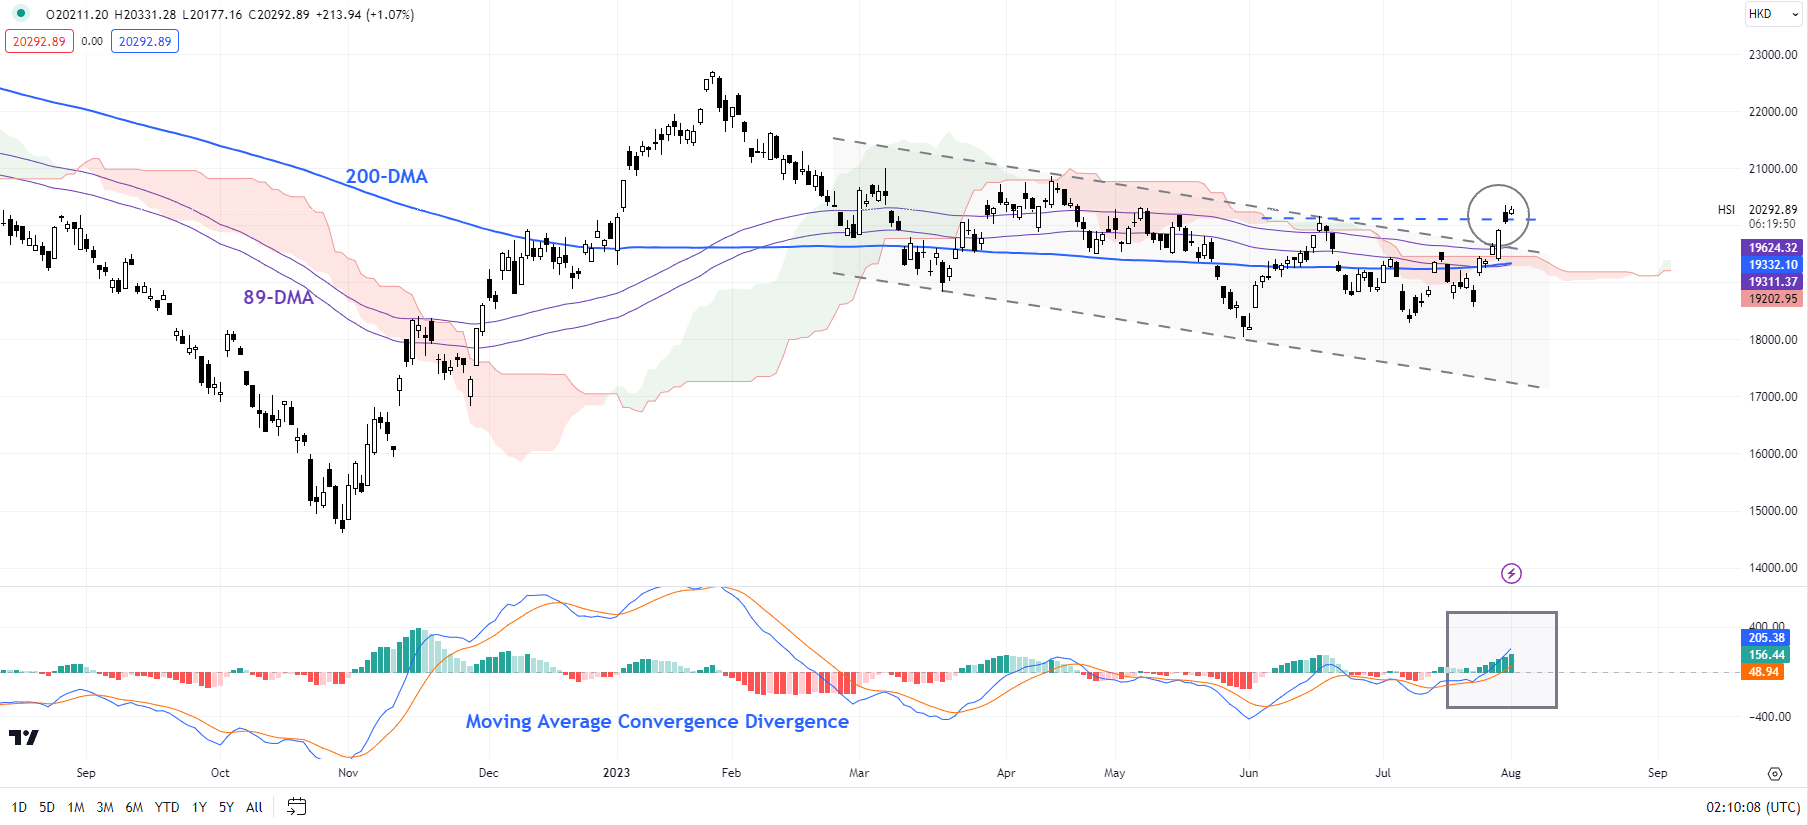
Chart Created Using TradingView
On the weekly charts, after declining from January onwards, the index held ground around the lower edge of the Ichimoku cloud on the weekly charts, just as the 14-week Relative Strength Index found support around the crucial 40-mark. In the process, the index formed a higher low, an early sign of base building.
CSI 300 Index Weekly Chart
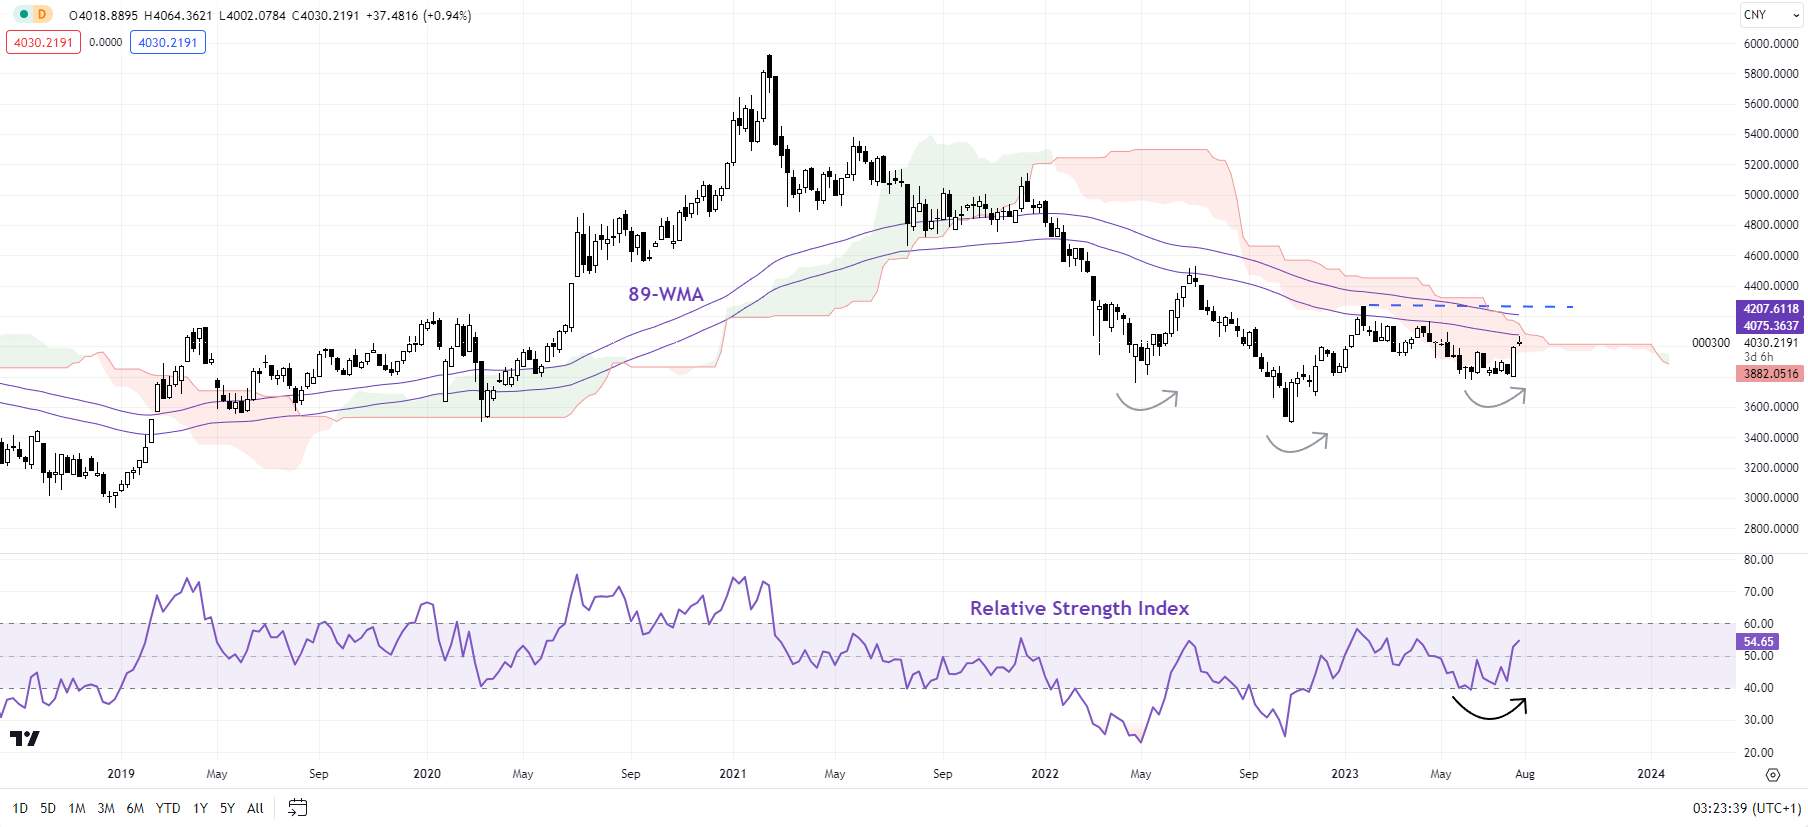
Chart Created Using TradingView
CSI 300: Base building?
The higher low formed in mid-2023 raises the prospect of base building in the CSI 300 index, a point confirmed by the 14-week Relative Strength Index holding above the crucial 40-mark. However, unless the index surpasses the immediate ceiling at the February high of 4268, the path of least resistance remains sideways to down. Any break above could raise the odds that the downward pressure was easing, exposing the upside toward 4500.
Recommended by Manish Jaradi
How to Trade the “One Glance” Indicator, Ichimoku
— Written by Manish Jaradi, Strategist for DailyFX.com
— Contact and follow Jaradi on Twitter: @JaradiManish
منبع: https://www.dailyfx.com/news/hk-china-equities-attempt-to-build-base-on-stimulus-hopes-hang-seng-csi-300-price-setups-20230801.html