
WTI, Brent Crude Oil Analysis
- Fitch downgrade spooks risk assets with oil proving vulnerable too
- WTI oil heads lower after respecting significant zone of resistance
- Brent crude oil eyes $82 as first real test of bearish momentum
- The analysis in this article makes use of chart patterns and key support and resistance levels. For more information visit our comprehensive education library
Recommended by Richard Snow
Get Your Free Oil Forecast
Fitch Downgrade Spooks Risk Assets
After the Fitch ratings agency downgraded US long-term debt, risk assets have taken the brunt of the decision. European indices, a large contingent of the commodity complex and pro-cyclical currencies like the Australian dollar have all been on the receiving end with varying degree.
The oil market is no exception, trading lower after what can be described as a solid bullish advance since the start of July when Saudi Arabia’s voluntary 1 million barrels per day (mbpd) cut came into effect. Before the cuts, oil prices had been languishing around $70 per barrel since early May.
The effects of the downgrade are said to have no long-lasting repercussions for the US, with the decision drawing disbelief from the US Treasury as Janet Yellen suggested the data relied upon was old and that the US has moved on from the debt ceiling standoff from earlier this year.
WTI Oil Heads Lower After Respecting Significant Zone of Resistance
WTI had been on an amazing run since the start of July, when Saudi Arabia’s voluntary cut was felt in the market (denoted by the solid vertical line). Encouraging US fundamental data in the US also helped reignite the ‘soft landing’ narrative, spurring on the oil market.
The zone of resistance around $82.50 provided the opportune level for the pullback to develop. An extended pullback could see oil prices heading towards $77.40 – a long-term level of significance – which would roughly coincide with the 200 simple moving average (SMA). Oil bulls could be watching this level closely for any signs of bearish fatigue and a possible continuation of the prior upward advance back towards $82.50.
In the event the selloff continues, $73.90 and $72.50 appear as the next levels of support before the psychological level of $70 flat.
WTI Crude Oil Daily Chart
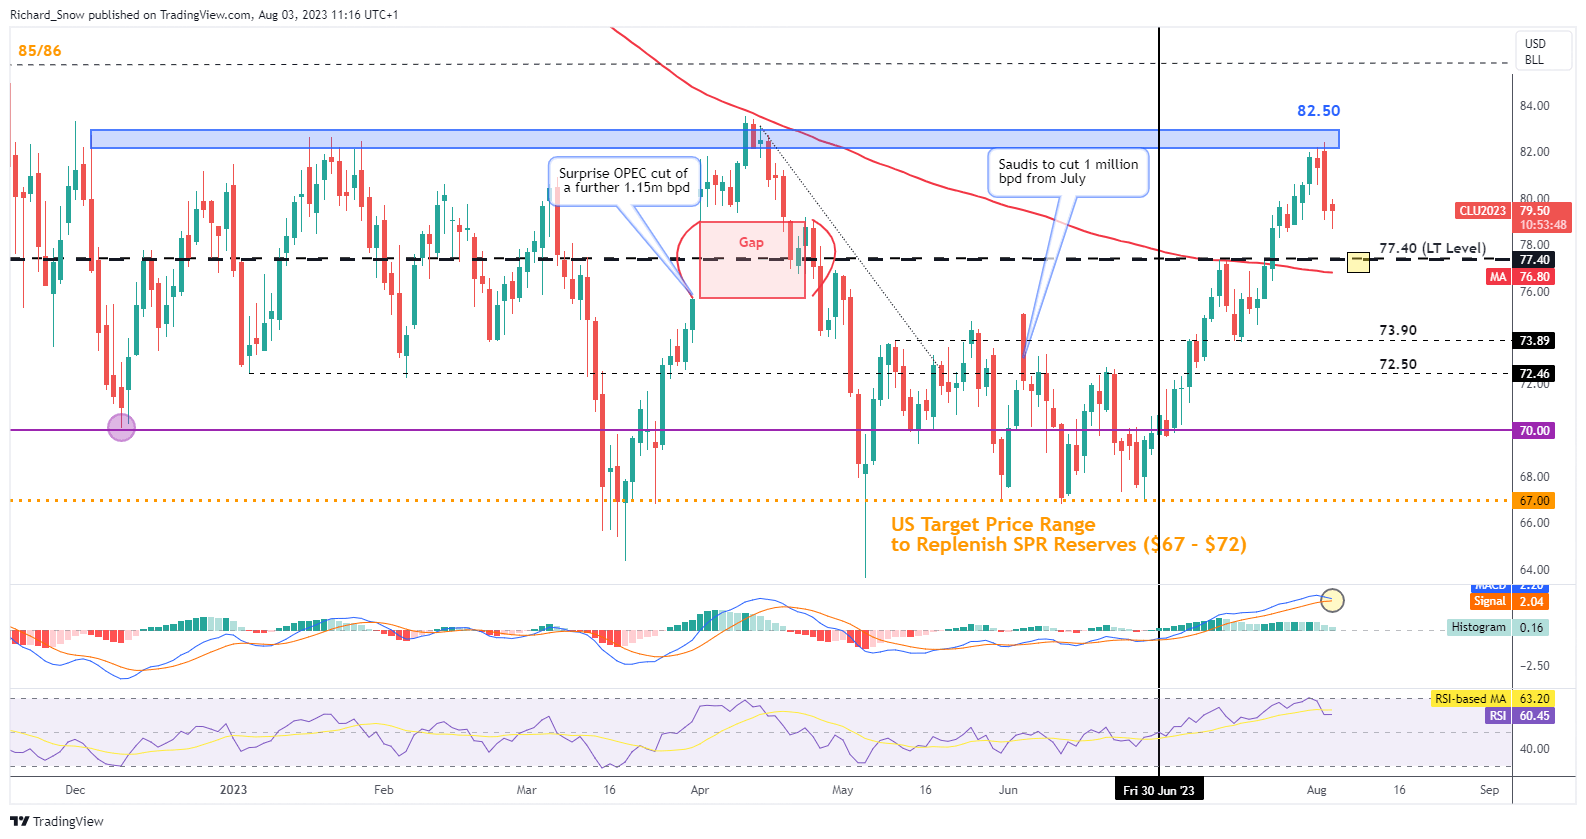
Source: TradingView, prepared by Richard Snow
Brent Crude Oil Eyes $82 as First Real Test of Bearish Momentum
Brent crude has traded broadly in line with that seen in WTI, now approaching the $82 mark which coincides with the 200 simple moving average (SMA). The RSI reveals a recovery from overbought territory as prices ease further. Downside levels of interest emerge via $78.60 – the level of resistance in May and June – before a move towards $71.50 would complete a full retracement of the impressive bullish advance.
Should $82 hold, bullish continuation setups may eye $87 before the early 2023 high at $89.
Brent Crude Oil Daily Chart
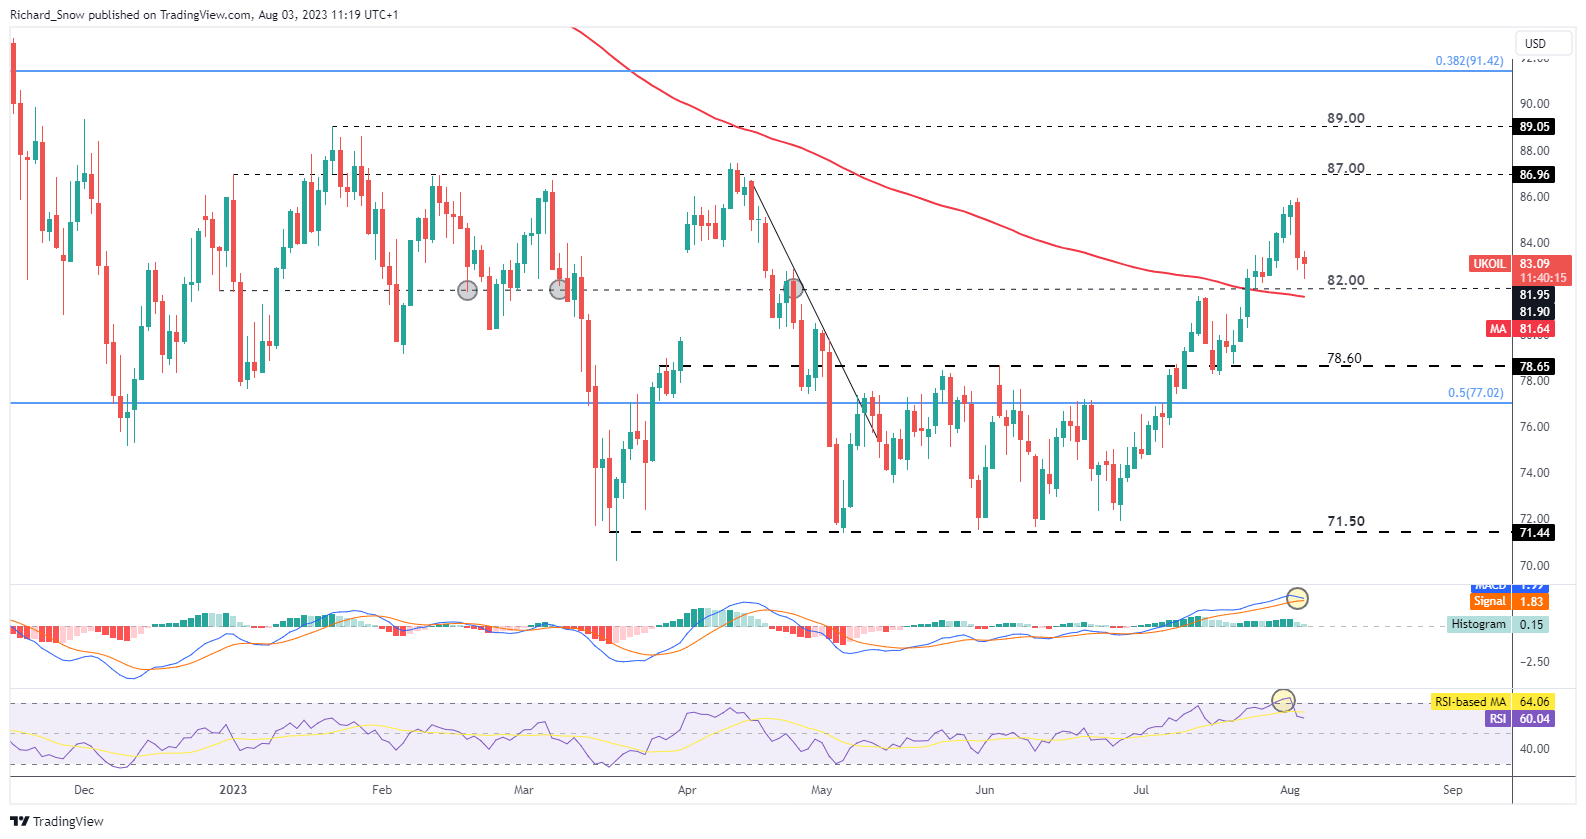
Source: TradingView, prepared by Richard Snow
— Written by Richard Snow for DailyFX.com
Contact and follow Richard on Twitter: @RichardSnowFX
منبع: https://www.dailyfx.com/news/oil-price-update-wti-and-brent-pullback-on-continuing-risk-off-sentiment-20230803.html