
BRENT CRUDE OIL ANALYSIS & TALKING POINTS
- US core PCE dampens hawkish rhetoric.
- China and US economic data in focus next week.
- How long can bulls sustain this upside?
Recommended by Warren Venketas
Get Your Free Oil Forecast
BRENT CRUDE OIL FUNDAMENTAL BACKDROP
Crude oil prices (WTI and Brent) have extended its upside rally to end the week on levels last seen in mid-April 2023. The move was sparked by multiple factors but primarily the weaker U.S. dollar Friday’s miss on both core PCE price index and Michigan consumer sentiment data. Core PCE also known as ‘the Fed’s preferred measure of inflation hit 4.1% showing yet further signs of slowing inflationary pressures – echoing the recent CPI report. This data minimized the impact of strong US GDP and durable goods orders a few days earlier that has weighed negatively on the greenback. Next week will kickoff with key data from China (see economic calendar below) via the NBS PMI release that is expected to push higher possibly giving crude oil prices further support. The Caixin report is also due later in the week.
Trade Smarter – Sign up for the DailyFX Newsletter
Receive timely and compelling market commentary from the DailyFX team
Subscribe to Newsletter
From a USD perspective, US PMI’s and Non-Farm Payroll (NFP) figures are scheduled. The usual crude oil weekly stock change numbers (API and EIA) will be closely watched while the Baker Hughes rig count that has been steadily declining could heighten supply concerns. OPEC+ and their recent production cut extension announcement through August has resurfaced as to whether or not the organization will decide to continue into September as well. Market experts are leaning towards another sustained cut
U.S. ECONOMIC CALENDAR (GMT +02:00)
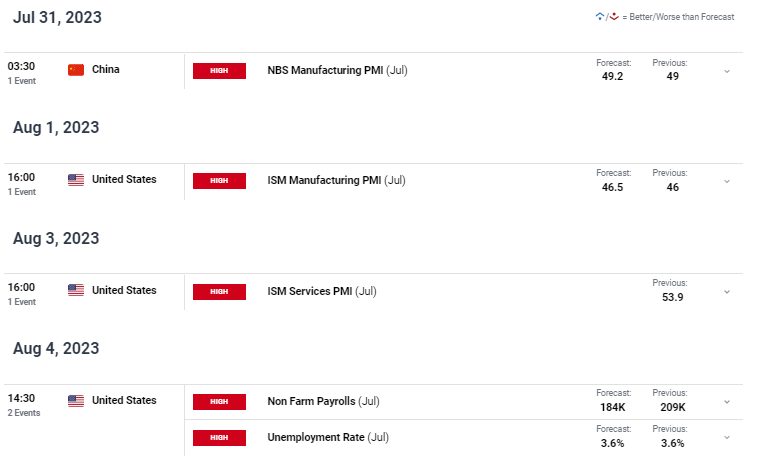
Source: DailyFX economic calendar
Foundational Trading Knowledge
Commodities Trading
Recommended by Warren Venketas
TECHNICAL ANALYSIS
BRENT CRUDE OIL PRICE CHART (DAILY)

Chart prepared by Warren Venketas, IG
Brent crude price action has reached the overbought zone on the Relative Strength Index (RSI) heading towards the 85.00 psychological resistance handle. The 200-day moving average (blue) has also been breached in this process. It will be interesting to see how long this can hold with global growth concerns gaining traction.
Key resistance levels:
Key support levels:
IG CLIENT SENTIMENT: BULLISH
IGCS shows retail traders are NET SHORT on crude oil, with 53% of traders currently holding short positions (as of this writing). At DailyFX We typically take a contrarian view to crowd sentiment, and the fact traders are net-short suggestscrude oil- US Crude prices may continue to rise. Traders are further net-short than yesterday and last week, and the combination of current sentiment and recent changes gives us a stronger Oil – US Crude-bullish contrarian trading bias.
Contact and followWarrenon Twitter:@WVenketas
منبع: https://www.dailyfx.com/news/crude-oil-forecast-attention-shifts-to-opec-production-cuts-wv-20230729.html