
Crude Oil, WTI, Brent, Fitch, US Treasury, EIA, API, RBOB, Backwardation, OVX – Talking Points
- Crude oil headwinds mount despite favourable inventory data
- A switch may have been flicked in the underlying structure of the WTI futures market
- If pessimism swells for markets from here, will WTI go lower?
Recommended by Daniel McCarthy
How to Trade Oil
Crude oil prices tumbled despite a massive drop in stockpiles in the US as risk aversion ricocheted through markets in the aftermath of Fitch downgrading US sovereign debt.
The credit rating agency, Fitch, downgraded the US to AA+ from AAA for the first time in almost 30 years.
Compounding concerns around US debt, the Department of Treasury announced that they will seek to issue US$ 103 billion next week, up from the US$ 96 billion last time.
At the start of the trading on Wednesday, the WTI futures contract is a touch above US$ 79.50 bbl while the Brent contract is trading over US$ 83 bbl. Live prices can be found here.
The US Energy Information Agency (EIA) weekly petroleum status report revealed a massive drop of -17.049 million barrels for the week ended July 28th, much lower than the -1.367 million anticipated and -600k prior.
It comes hot on the heel of the American Petroleum Institute (API) inventory report the day before that showed -15.4 million fewer barrels in stock for the same week. Again, that was well below the -900k forecast.
Regardless, broader market sentiment moved away from growth-orientated assets with concerns that the central bank tightening cycle is coming to an end for a reason. That is, forward-looking economic activity might be mired across several key markets.
Cyclically exposed currencies such as the Aussie, Kiwi and Norwegian Krone Krone have been hit the hardest in the last 24 hours along with equity markets across the globe.
With this kind of mood in markets, crude oil succumbed to selling pressure after failing to overcome the highs of 2023 that were seen in April.
The underlying structure of the futures market had been supportive of the oil rally but might have rolled over yesterday and today.
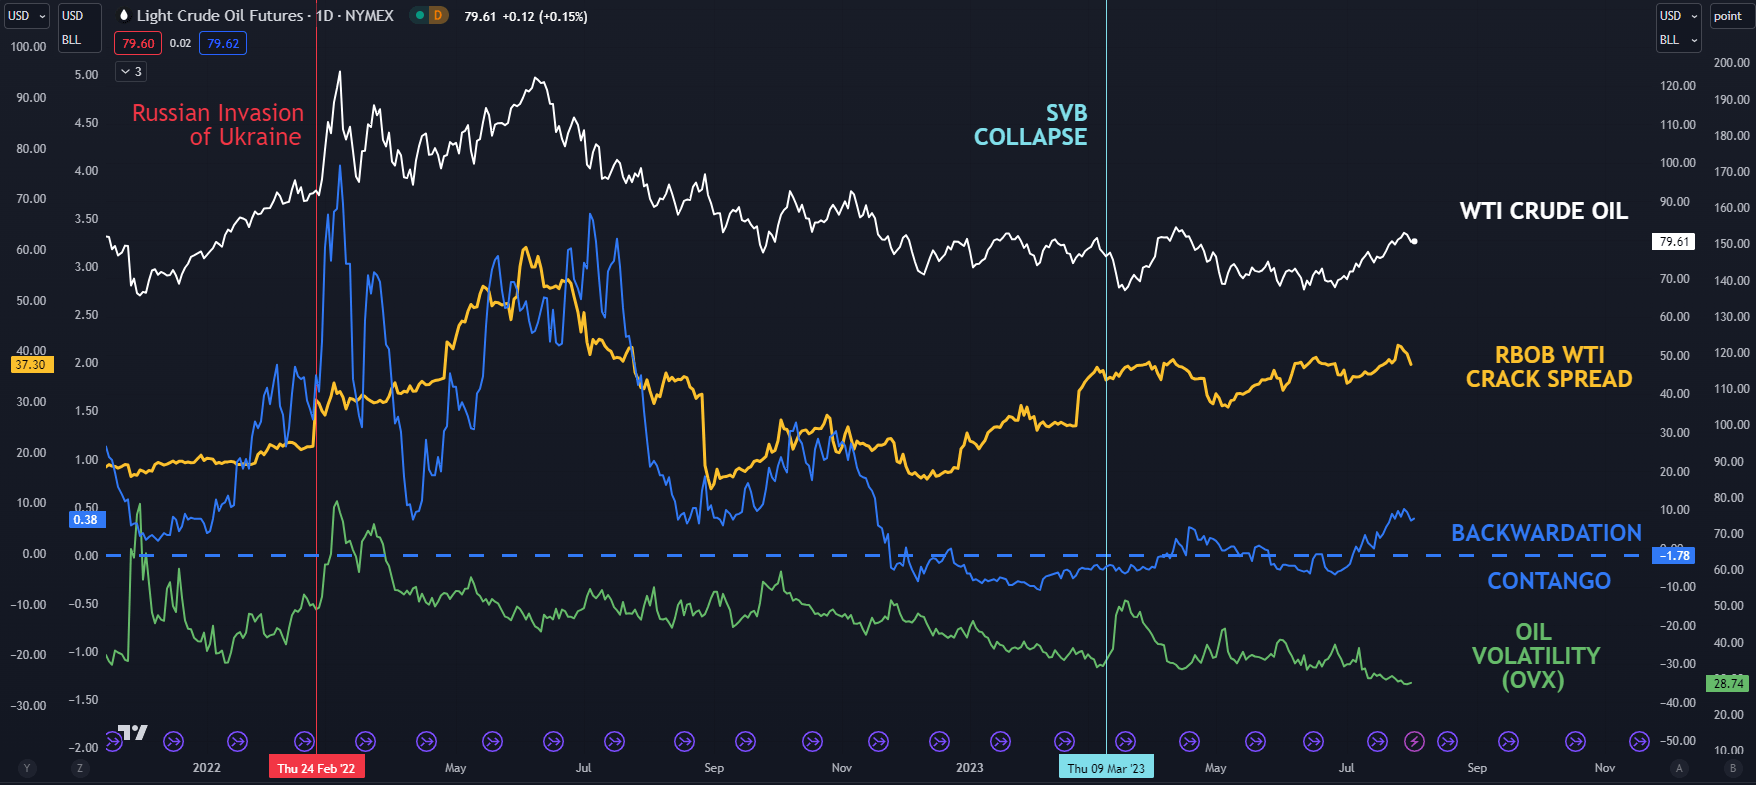
The RBOB crack spread ticked lower after trading at its highest level since this time last year. The RBOB crack spread is the gauge of gasoline prices relative to crude oil prices and reflects the profit margin of refiners.
Backwardation between the front 2 WTI futures contracts had been moving in a bullish direction for crude, but it too appears to have stalled for now.
At the same time, the OVX index continues to languish at its lowest level since 2019 which may indicate that the market is non-plussed about the pullback in price.
Given that the move is back toward the middle of the range for this year, it seems like a rational response. To learn more about range trading, click on the banner below.
Recommended by Daniel McCarthy
The Fundamentals of Range Trading
The OVX index measures volatility in the WTI oil price in a similar way that the VIX index gauges volatility on the S&P 500.
Going forward, if risk aversion continues to widen and the structure of the futures market deteriorates, WTI might move further toward the middle of the 2023 range which is near US$ 73.
WTI CRUDE OIL, RBOB CRACK SPREAD, BACKWARDATION AND VOLATILITY (OVX)
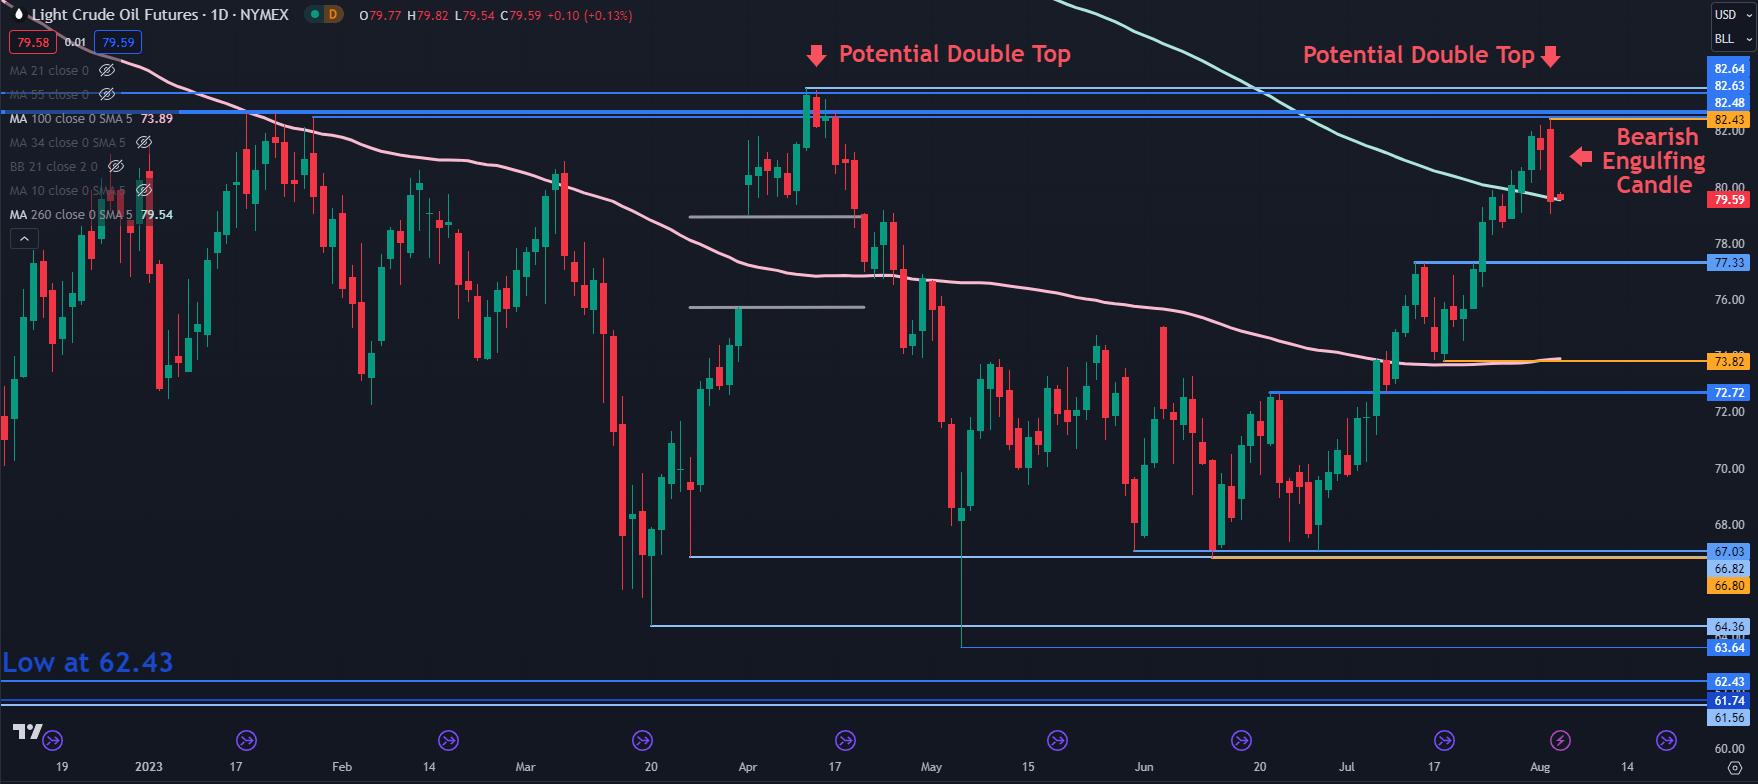
WTI CRUDE OIL TECHNICAL ANALYSIS SNAPSHOT
The WTI futures contract made a 3 month high yesterday before retreating to make a Bearish Engulfing Candlestick.
Also of concern for the bulls is a potential Double Top. A move above yesterday’s peak of 82.43 would negate both of these bearish formations.
However, just above that high, the 82.50 83.50 might be a resistance zone with several previous peaks and breakpoints.
On the downside, the price is trading near the 260-day day simple moving average (SMA) at 79.54. A clean break on either side of it could signal momentum in that direction.
Support may lie at the breakpoint of 77.33, or the prior low of 73.82 which also coincides with the 100-day SMA.
— Written by Daniel McCarthy, Strategist for DailyFX.com
Please contact Daniel via @DanMcCarthyFX on Twitter
منبع: https://www.dailyfx.com/news/crude-oil-crunched-as-markets-recoil-from-fitch-downgrade-lower-wti-20230803.html