
USD/JPY Analysis
- USD/JPY edges higher after uptick in US CPI reinforces ‘higher for longer’ narrative
- Fed forecasts in focus as markets look for confirmation on peak rates and CPI forecasts
- IG client sentiment hints at bullish fatigue as recent positioning data reveals a change in course
- The analysis in this article makes use of chart patterns and key support and resistance levels. For more information visit our comprehensive education library
USD/JPY edges higher after US CPI reinforces ‘higher for longer’ narrative
At the start of the week, Bank of Japan Governor Ueda stated the bank may have enough data to make a decision on ending negative interest rates by year end. This immediately resulted in a shift higher in the Japanese bond market as rates on the 10-year Japanese government bond yield trounced the prior high of 0.682 and still climbing.
10-Year Japanese Government Bond Yields
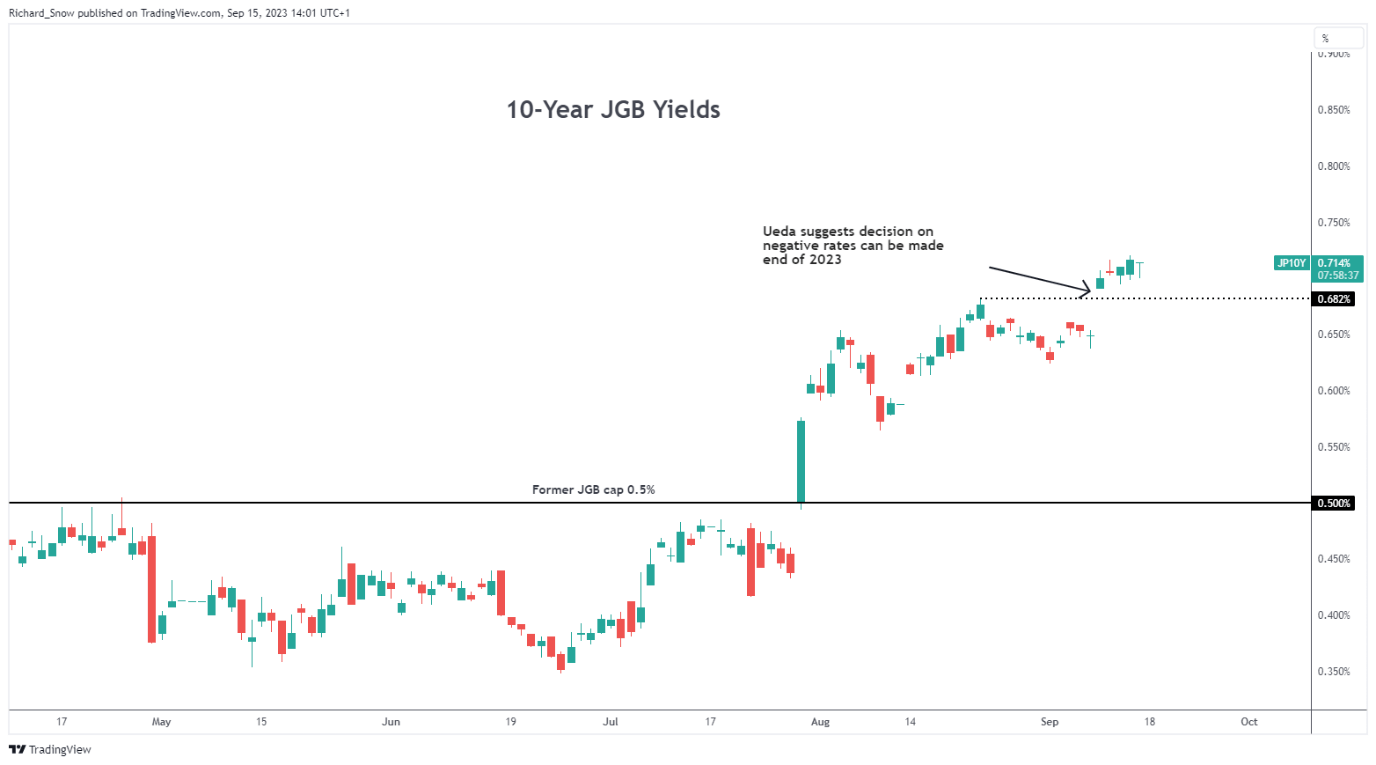
Source: TradingView, prepared by Richard Snow
Naturally, Governor Ueda’s comments resulted in yen appreciation and an opportunity appeared for the pair to pullback after an admittedly short advance which broke new ground for the year.
The pullback found support at 146.50 and has headed higher the rest of the week. Ahead of the FOMC decision on Wednesday, markets are likely to revisit concerns about FX intervention by the Japanese Ministry of Finance, particularly if we get a hawkish message from the Fed or see the summary of economic projections point to higher inflation figures than previously forecasted. 150 is the level of resistance with 146.50 remaining as support.
There may be a refrain from traders to enter at such elevated levels as this may be likened to picking up pennies in front of a steam roller – the potential reward does not outweigh the risk involved.
Recommended by Richard Snow
How to Trade USD/JPY
USD/JPY Daily Chart
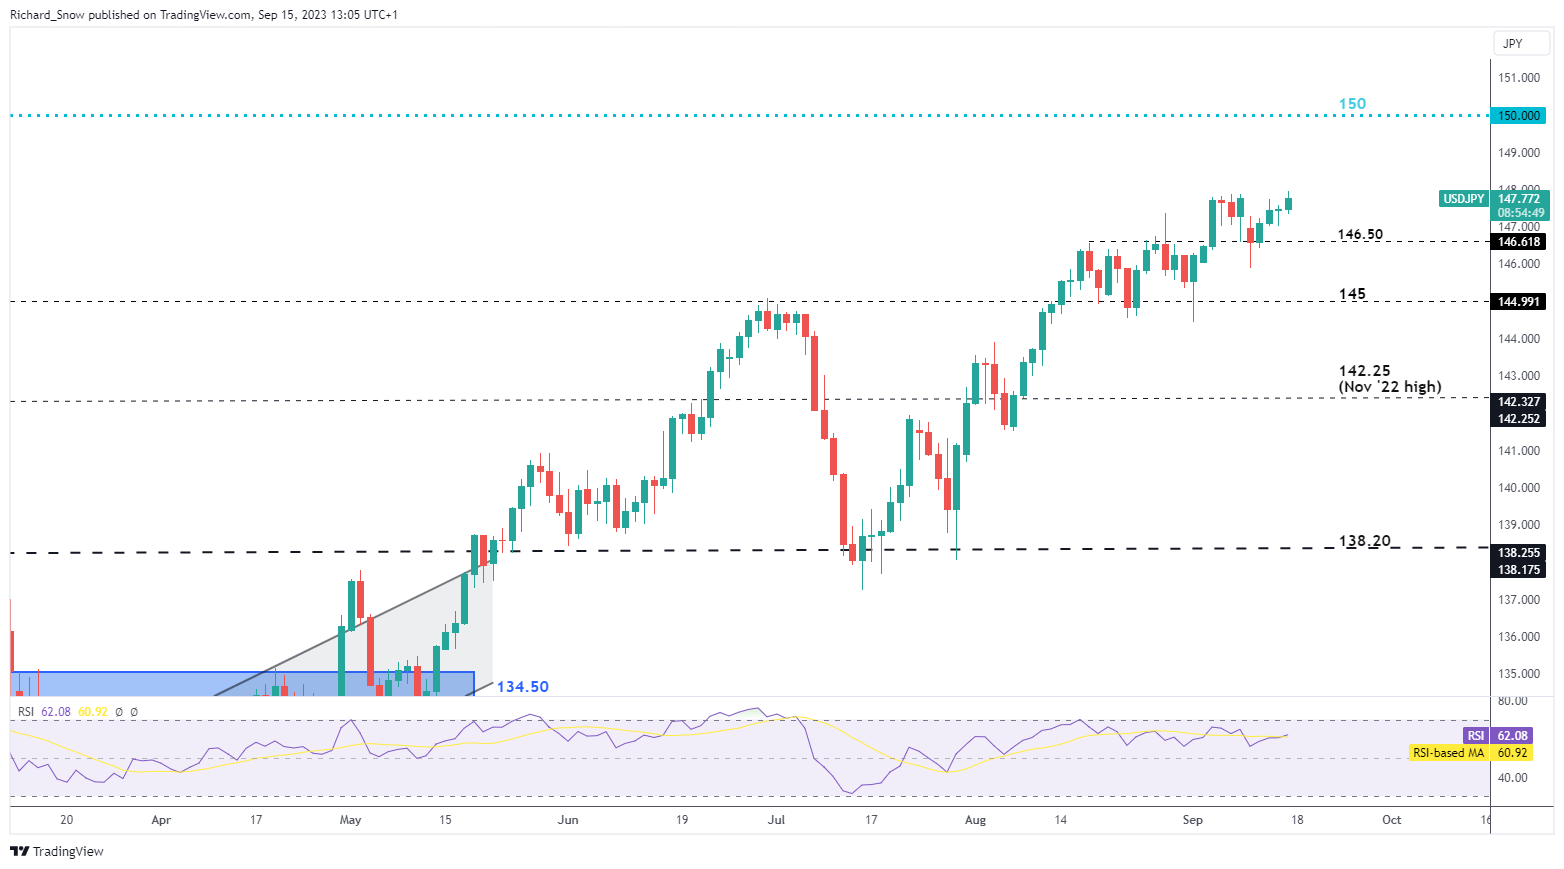
Source: TradingView, prepared by Richard Snow
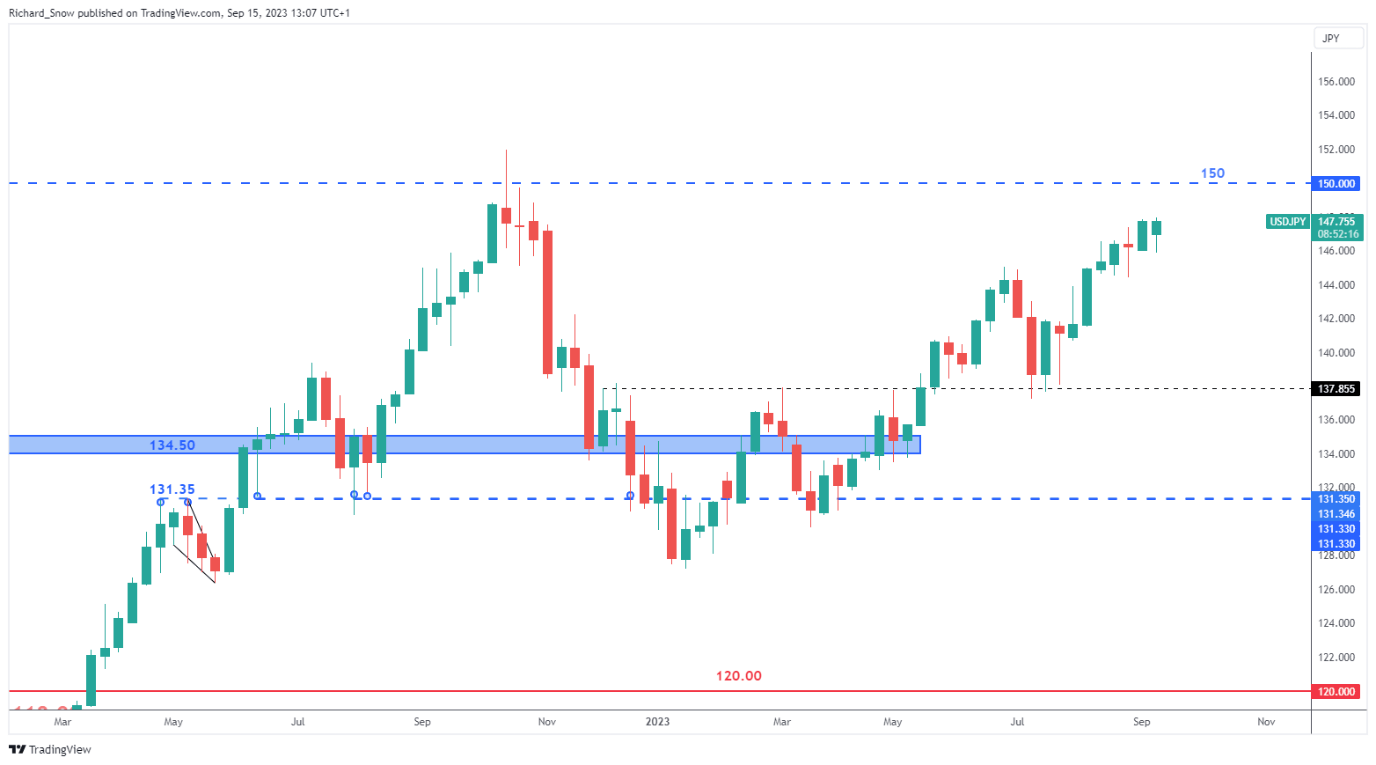
The weekly chart shows the steady rise in USD/JPY, continuing to make new yearly highs but still short of the 2022 high just shy of 152.00.
USD/JPY Weekly Chart Source: TradingView, prepared by Richard Snow
IG Client Sentiment Warns of Fading Bullish Momentum
Recent changes in positioning complicate the now bearish outlook provided by the contrarian indicator as traders remain net short.
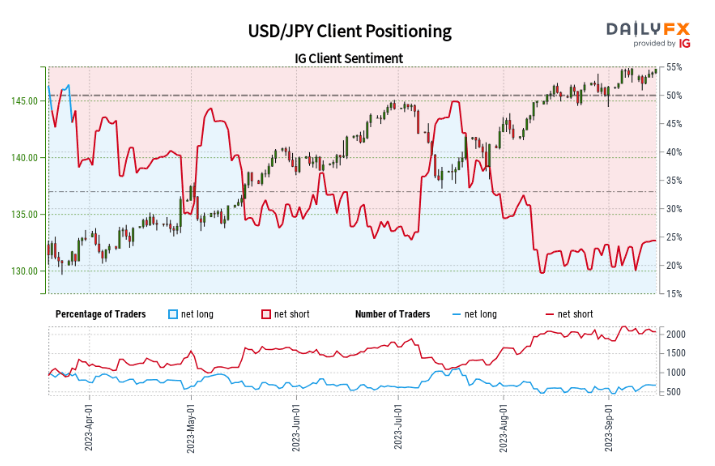
Source: TradingView, prepared by Richard Snow
USD/JPY:Retail trader data shows 24.49% of traders are net-long with the ratio of traders short to long at 3.08 to 1. We typically take a contrarian view to crowd sentiment, and the fact traders are net-short suggests USD/JPY prices may continue to rise.
Find out why recent changes in sentiment point to the possibility of a downside move in USD/JPY by reading our dedicated guide on IG client sentiment below:
| Change in | Longs | Shorts | OI |
| Daily | -11% | 2% | -1% |
| Weekly | -7% | 3% | 1% |
Trade Smarter – Sign up for the DailyFX Newsletter
Receive timely and compelling market commentary from the DailyFX team
Subscribe to Newsletter
— Written by Richard Snow for DailyFX.com
Contact and follow Richard on Twitter: @RichardSnowFX
منبع: https://www.dailyfx.com/news/will-a-hawkish-fed-force-tokyo-s-hand-amid-fx-intervention-concerns-20230915.html